

Any iOS Developer knows that writing code is only half the job; the other half, and often the most challenging, is figuring out why that code doesn’t work as expected. Swift programming has evolved enormously, and with the advent of declarative paradigms, the tools we use to hunt down bugs have also had to adapt.
If you want to master development in the Apple ecosystem, learning how to debug in Xcode efficiently is not optional; it’s a superpower. Whether you’re building the next big iPhone app, a productivity tool for Mac, or a health app for the Apple Watch, mastering the art of debugging will save you hundreds of hours of frustration.
In this extensive tutorial, we will explore in depth how to debug applications written in Swift and SwiftUI using Xcode. We’ll cover everything from breakpoint fundamentals to advanced view debugging and performance techniques in iOS, macOS, and watchOS.
1. The Art of Debugging in Xcode: Fundamentals for the iOS Developer
Before diving into the specifics of SwiftUI, we must understand the core tools that Xcode provides. Xcode’s underlying debugger is LLDB (Low Level Debugger), an incredibly powerful tool that runs in the Xcode console.
1.1. Mastering Breakpoints
The breakpoint is any developer’s best friend. It allows you to pause the execution of your application at a specific line of code to inspect the program’s state.
- Standard Breakpoints: Simply click on the line number in the code editor. When execution reaches that point, the app will pause.
- Conditional Breakpoints: Do you have a loop of 1000 iterations and the error only occurs on number 999? Don’t press “Continue” 999 times. Right-click on the breakpoint, select Edit Breakpoint, and add a condition in Swift (for example,
index == 999). Execution will only stop when the condition is true. - Action Breakpoints: You can configure a breakpoint to execute an action without stopping the application. In the breakpoint editor, add a “Log Message” action and enter
The current value is @myVariable@. Check the Automatically continue after evaluating actions box. This is infinitely better and cleaner than cluttering your code withprint().
1.2. The LLDB Console
When your application stops at a breakpoint, the Xcode debugging area comes to life. In the console (bottom right corner), you can interact directly with your code using LLDB commands:
po(Print Object): Prints the description of an object. It is the most used command in Swift programming to see the contents of complex variables.p(Print): Unlikepo,poutputs the actual value without calling the object’sdescriptionproperty. It’s faster but sometimes less readable on screen.v(Frame Variable): Evaluates the variable in the current stack frame without compiling additional code. It is extremely fast and excellent for local variables.
2. Debugging in SwiftUI: A New Paradigm
Debugging in UIKit used to be very straightforward: you checked if the internal state of your UIViewController was correct. But SwiftUI is declarative; the view is a function of its state. This means problems usually arise from inconsistent states, infinite redraw loops, or Environment injection issues.
2.1. Identifying Why a View Redraws
One of the most common problems for an iOS Developer working with SwiftUI is excessive view redrawing (View Reloading), which can destroy app performance. To debug in Xcode for this issue, Apple introduced an undocumented but essential method: Self._printChanges().
You can insert this method directly inside your view’s body so the console tells you exactly which state change caused the view to re-render.
import SwiftUI
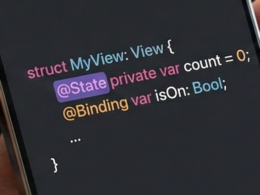
struct MyComplexView: View {
@State private var counter = 0
@Binding var title: String
var body: some View {
// Xcode will print in the console which property changed
let _ = Self._printChanges()
VStack {
Text(title)
Button("Increment: \(counter)") {
counter += 1
}
}
}
}
When running this, the Xcode console will tell you something like: MyComplexView: @self, @identity, _counter changed., allowing you to isolate the problem quickly.
2.2. Debug View Hierarchy
When your graphical interface doesn’t look as expected (a button doesn’t appear, text is cut off, or modifiers aren’t applied correctly), the Debug View Hierarchy tool is your lifesaver.
While the app is running in the simulator or on a device, click the Debug View Hierarchy button (the icon that looks like a three-layer sandwich in the bottom debug bar). Xcode will capture the current screen and explode it into 3D.
This is vital in SwiftUI because it allows you to see the actual bounding box of each element. You’ll often find that an invisible .padding() or a misplaced Spacer() is pushing your content off the screen.
3. Debugging Across Different Platforms: iOS, macOS, and watchOS
Swift code might be universal, but each Apple operating system has its own quirks that an iOS Developer (and now a full Apple developer) must know when debugging in Xcode.
3.1. Debugging on iOS
iOS is the most mature environment in Xcode. Here, most bugs stem from memory management or concurrency issues.
- Main Thread Checker: In mobile development, updating the UI on a background thread is a fatal and common mistake. Xcode has a tool called Main Thread Checker (activated in Scheme -> Run -> Diagnostics settings). If your Swift code tries to modify SwiftUI or UIKit outside the main thread, Xcode will pause execution and warn you immediately.
- Simulator vs. Real Device: Always debug features like the camera, Bluetooth, or push notifications on a physical device. The simulator does not emulate everything perfectly.
3.2. Debugging on macOS
When bringing your SwiftUI code to macOS, you’ll face Sandboxing. Mac apps are heavily restricted in what they can access (files, network, hardware).
- If your Mac app fails silently when trying to read a file, the problem is almost always a missing App Sandbox permission in your
Entitlementsfile. - To debug in Xcode file system issues on macOS, make sure to check the console (macOS Console.app) looking for warnings from your application, as the system often blocks actions silently and logs them there, out of reach of Xcode’s standard debugger.
3.3. Debugging on watchOS
The Apple Watch presents severe memory and battery constraints.
- Network Debugging: The Apple Watch often delegates network tasks to the paired iPhone. When debugging network requests (URLSession) on watchOS, keep in mind whether you’re testing on the simulator (which uses your Mac’s connection directly) or on a physical Watch (which might be passing data via Bluetooth through the iPhone). This dramatically changes latency.
- Lifecycle: watchOS apps suspend very quickly. To debug how your app wakes up or handles notifications, use notification “Payloads” in Xcode. You can drag a JSON file with a push notification payload onto the watchOS simulator to test how the SwiftUI interface responds.
4. Memory Management and Performance
Even if your code doesn’t crash, a slow or battery-draining app will get uninstalled. Swift programming uses ARC (Automatic Reference Counting). Although efficient, it’s easy to create “Retain Cycles” where two objects keep each other alive in memory forever.
4.1. Memory Graph Debugger
To find memory leaks, use the Memory Graph Debugger in Xcode. Click the icon of three connected nodes in the debug bar.
Xcode will pause the application and show you a visual map of all objects in memory. If you see a SwiftUI object (like a view model or ObservableObject) that should have been destroyed when you closed a screen, but is still there with a purple arrow (indicating a strong cycle), you just found a Memory Leak. It’s usually fixed by ensuring you use [weak self] in your closures.
4.2. Using Instruments
When Xcode‘s standard debugger isn’t enough for performance issues (e.g., jerky animations in long SwiftUI lists), you need Instruments.
You can open it by pressing Cmd + I (Product -> Profile).
- Use the Time Profiler template to see exactly which Swift method is consuming the most processor time.
- Use SwiftUI Instruments to analyze view redraw counts and bottlenecks in animations.
Conclusion
Becoming an expert iOS Developer isn’t just about knowing all the SwiftUI APIs by heart, but knowing how to respond when things go wrong. Learning how to debug in Xcode using advanced breakpoints, the LLDB console, the view hierarchy inspector, and the memory analyzer will transform you from a reactive programmer to a proactive software engineer.
Swift programming gives you safety, Xcode gives you the tools, and SwiftUI offers you development speed. With these debugging skills in your toolbelt, you’re ready to tackle any technical challenge on Apple platforms.
If you have any questions about this article, please contact me and I will be happy to help you 🙂. You can contact me on my X profile or on my Instagram profile.